GENCG Working Journal - Day 2 - Grid Patterns
Today we started working on some iterative patterns in a grid. To start
things off I made some sketches of what I'd like to create in software
afterwards.
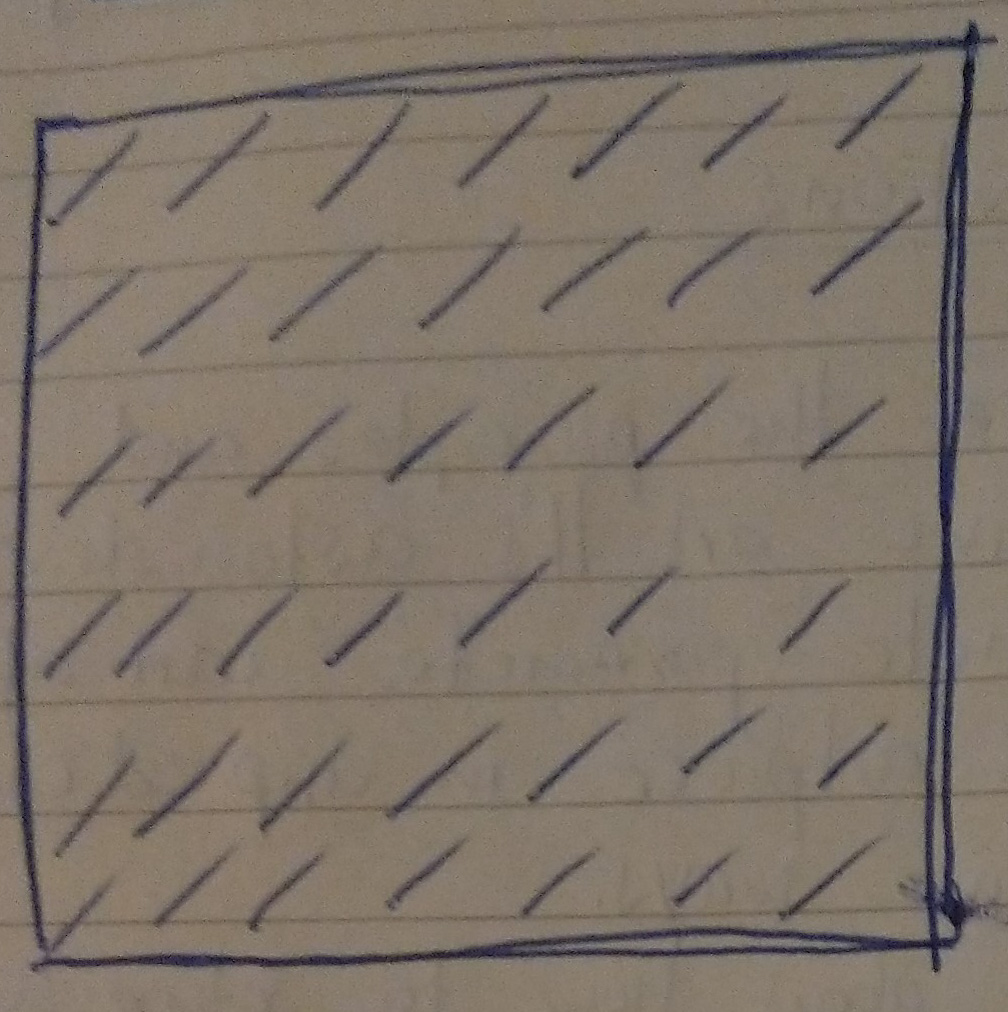
The lines in the first two examples should rotate itself in order to
follow the mouse position. First I tried to solve this by using the
built-in transformation functions from P5JS.
        // draw lines in a grid
        for (let y = tileWidth / 2; y < rows * tileWidth; y += tileWidth) {
          for (let x = tileWidth / 2; x < cols * tileWidth; x += tileWidth) {
            push();
            // calculate the angle so the line points to the mouse position
            let angle = Math.atan2(mouseY - y, mouseX - x);
            rotate(angle);
            line(x - tileWidth / 2, y, x + tileWidth / 2, y);
            pop();
          }
        }
Show me!
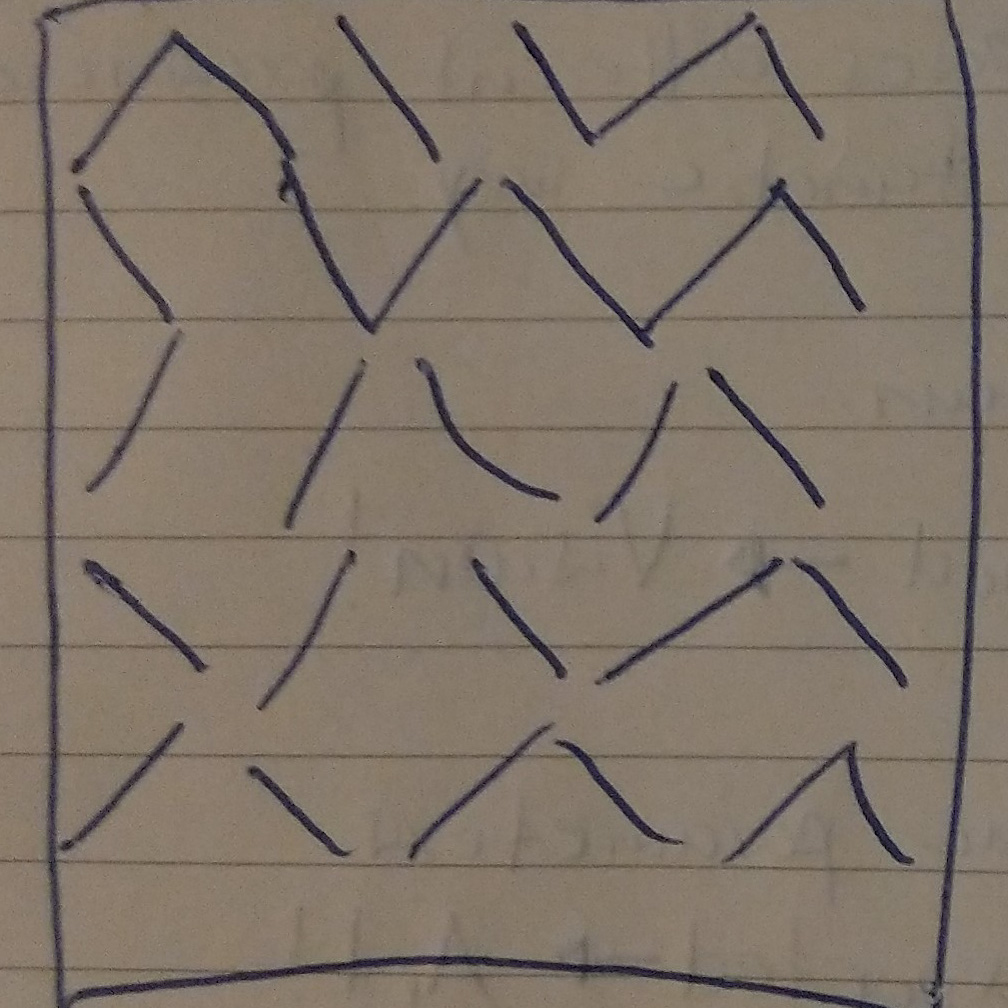
I must have gotten some calculation wrong, probably i'd need to do a
translate before I apply the rotate function. Nevertheless it looks
kinda cool. Also this failed example has something to it.
Show me!
Finally I decided to do the maths by myself, so I wouldn't get confused
by the whole push and pop mechanic of P5JS.Because it took me so long to
get this example right, I didn't manage to implement the third sketch I
had initially planned.
Show me!
        // draw lines in a grid
        for (let iY = 0; iY < rows; iY++) {
            for (let iX = 0; iX < cols; iX++) {
              let x = iX * tileWidth;
              let y = iY * tileWidth;
              let angle = atan2(mouseY - y, mouseX - x);
              //here I manually calculate the start and end points of the line instead of using rotate()
              line(x - cos(angle) * tileWidth / 2, y - sin(angle) * tileWidth / 2, x + cos(angle) * tileWidth / 2, y + sin(angle) * tileWidth / 2);
            }
        }
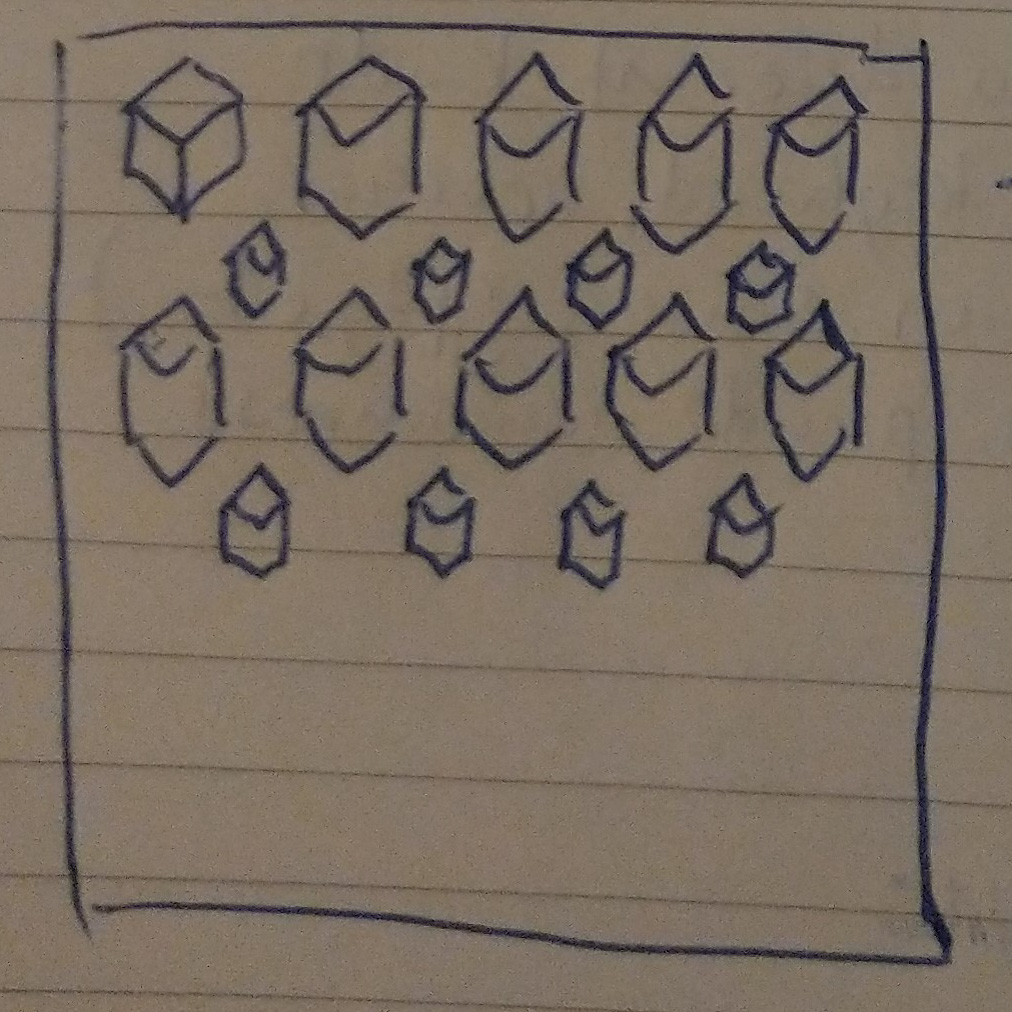
Instead of starting a whole new sketch, I wanted to develop this one a
bit further. Instead of redrawing the background each frame, I left the
existing lines stay, but reduced the opacity, so overlapping lines would
be more visible. Also I added some sine and
cosine functions to the length of each line over time.
And finally I mapped the color and
thickness of each line to the current
mouseposition on the canvas.
Show me!